Performance Results
There are two types of results that need to be explored, the speed and consistancy of the system. The first test that was run was a straight speed test, how fast could the system calcuate one of the largest samples the bioinformaticians needed. This used to take them ten days of processing time. I ran the test on the largest data set avaliable to me which contained 11764 sequences, which would require just short of 70 million comparisons. My program completed the calulations in 38,202 seconds, just over ten and a half hours. This at a speed of 1811 comparisons per second.
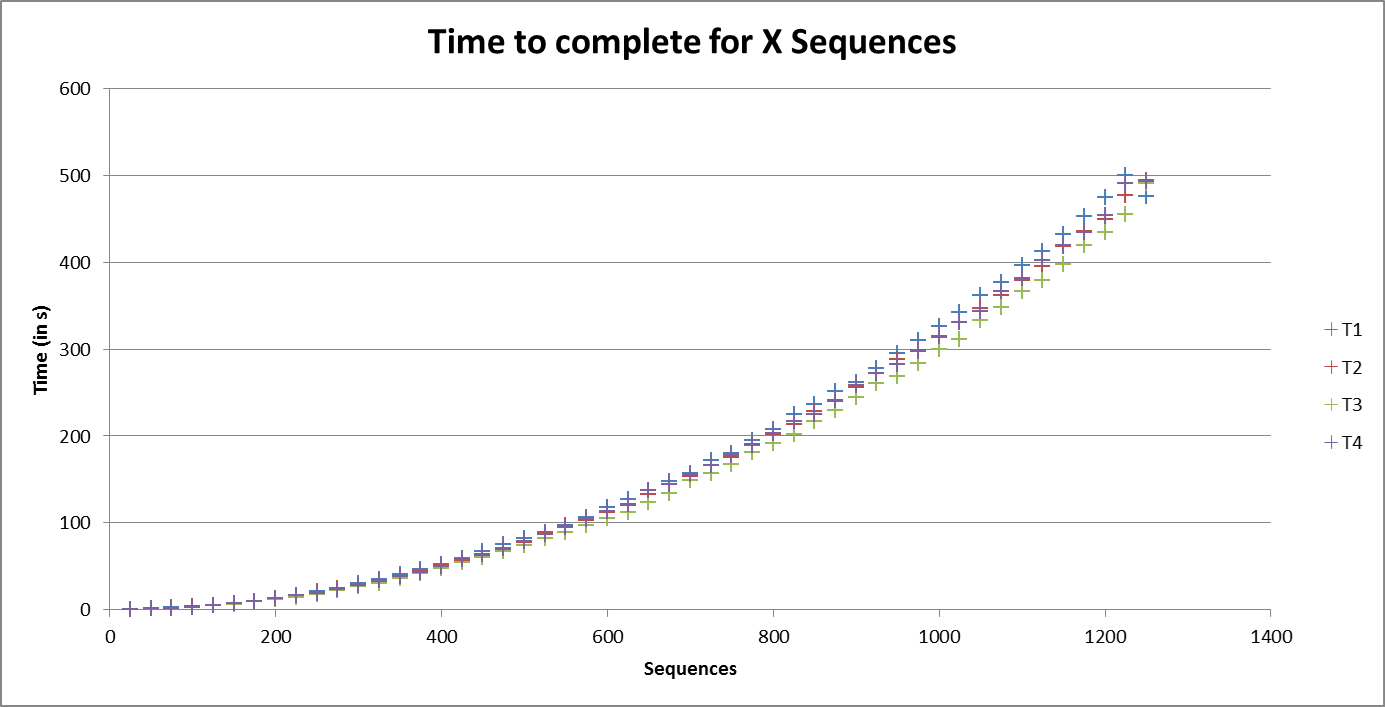
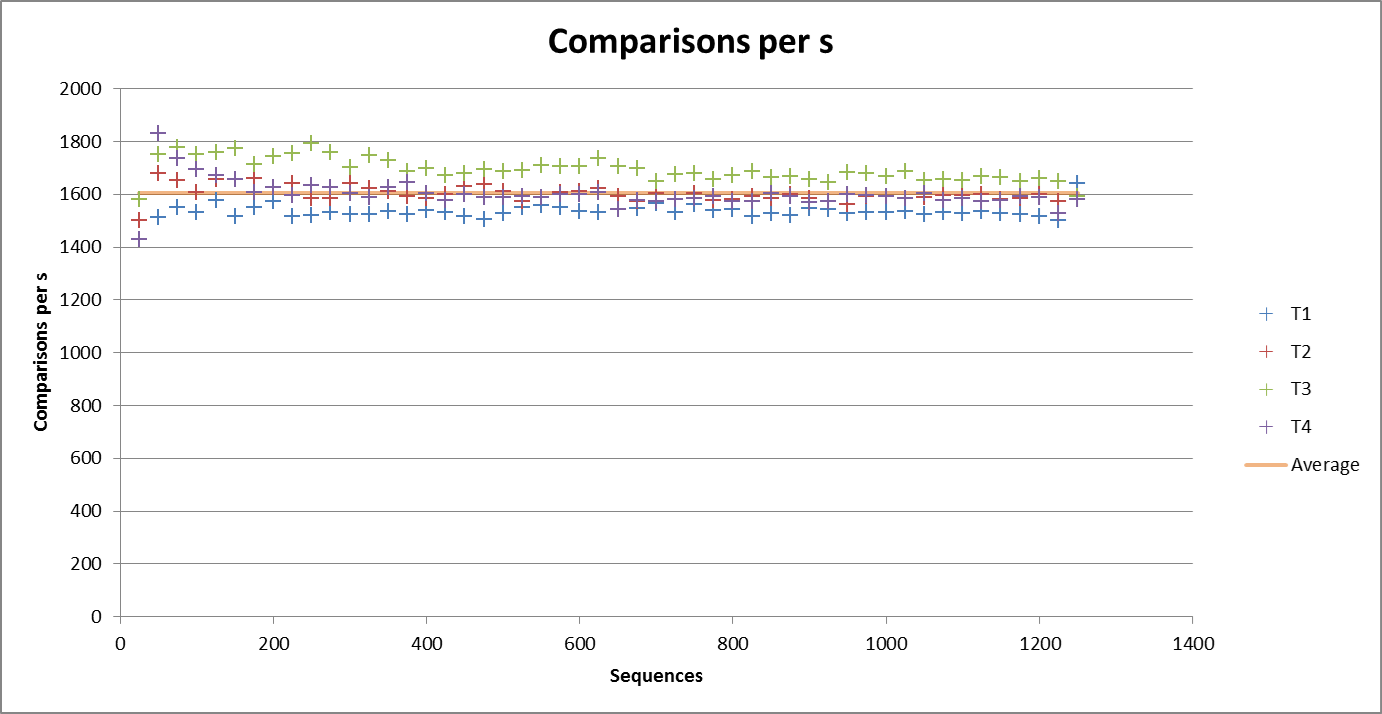
However my testing still needed to affirm the consistancy of the system, as, the system was not intended to run alone but concurrently with other samples of similar size being processed. Thus more tests were run testing samples from as small as 25 sequences to 1,250 sequences in 25 sequence increments with four tests being run side by side - the results are graphed below.
Firstly we can see that more or less consistant speed was attained throughout the tests. The reason for the tests executing slower than the single large sample tested above can be attributed to increased number of low level cache misses. Other reasons for variation are that each colour is taking sub samples from differnt large sample sets (T4 is the same sample as used above).
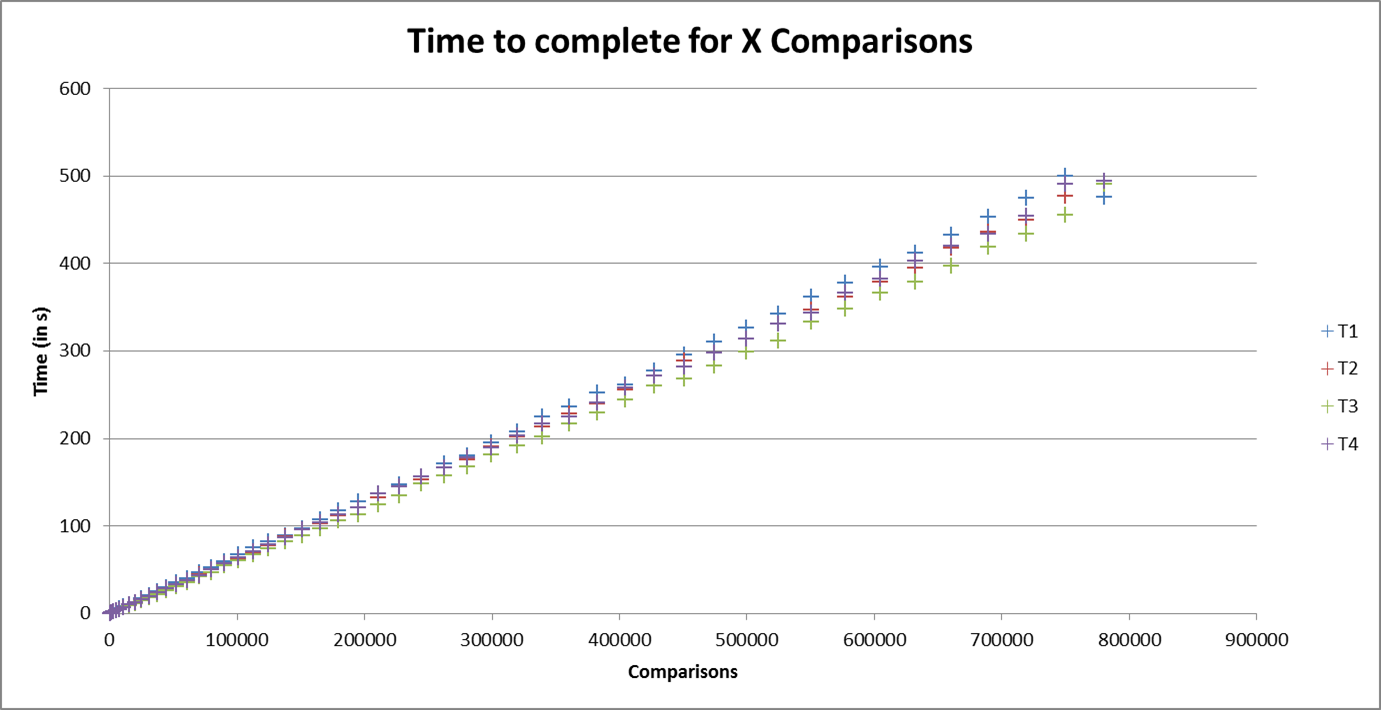
The next graph can completely affirm our expectations that the number of comparisons achieved over time is linear.
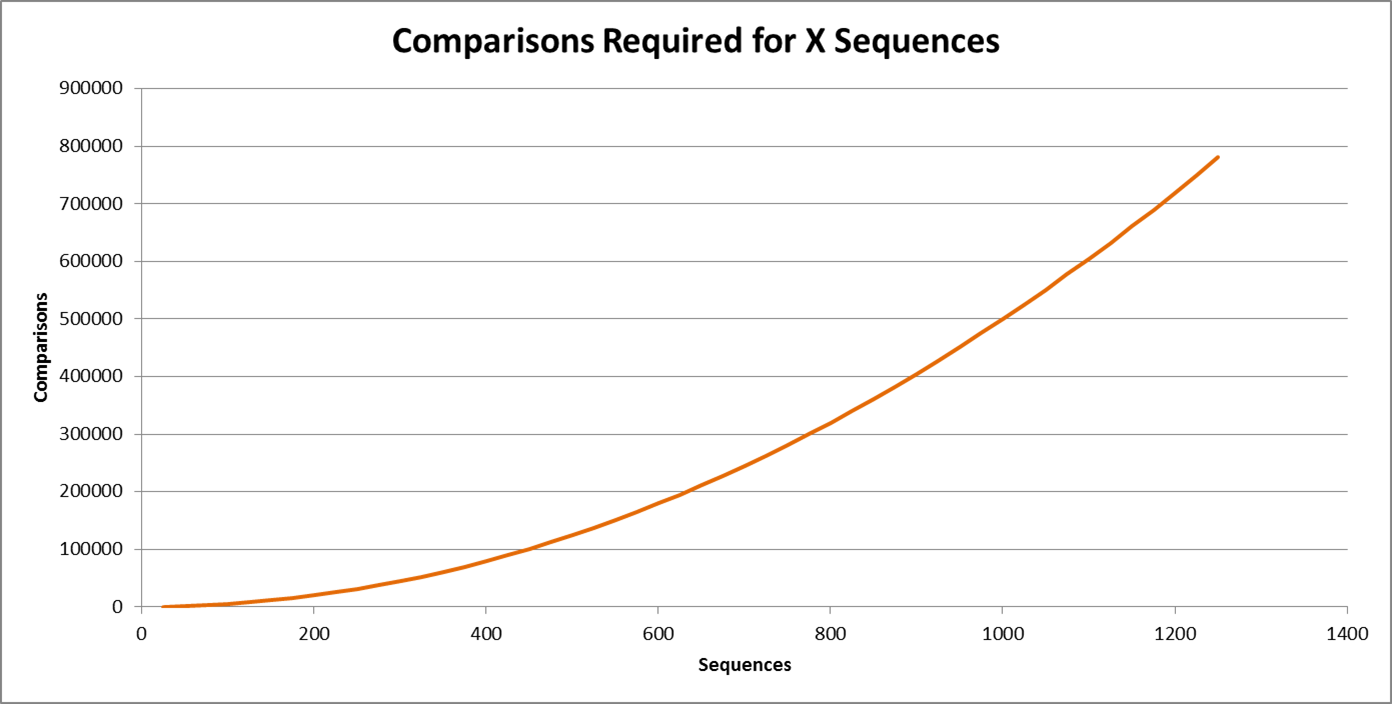
Thus we can expect the time to execute for a given number of sequences to hold a similar shape to that of the number of comparisons required per sequence. This can be observed on the following two graphs. The first is a graph of the number of comparisons required per sequence or n(n-1)/2 and the second is the time to execute the sequences. Thus we can see that time to execute is order n squared.