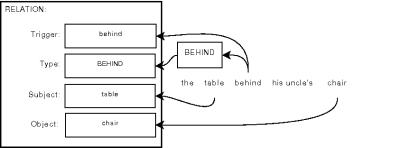
Figure 5.2(a): Example annotations from fiction text - Relation annotation.
843 x 312
(17 KB)
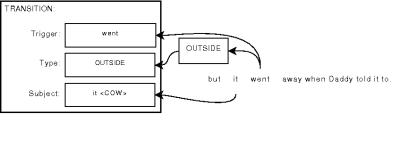
Figure 5.2(b): Example annotations from fiction text - Transition annotation.
847 x 312
(16 KB)
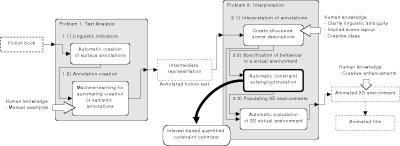
Figure 5.4: Context of the interval-based quantified constraint optimizer with respect to the fiction-to-animation problem.
1452 x 531
(29 KB)
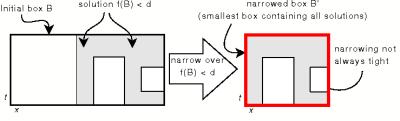
Figure 5.5(a): Graphical illustration of solution finding approach for constraints using universally quantified variables - Step 1: Narrow over constraint.
739 x 225
(19 KB)
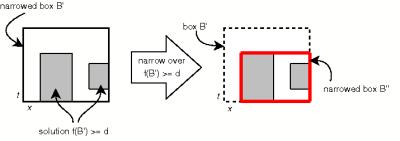
Figure 5.5(b): Graphical illustration of solution finding approach for constraints using universally quantified variables - Step 2: Narrow over negated constraint.
715 x 253
(17 KB)
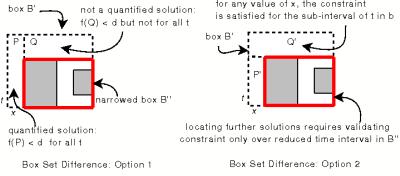
Figure 5.5(c): Graphical illustration of solution finding approach for constraints using universally quantified variables - Step 3: Box set difference yields a solution and smaller universally quantifed interval.
719 x 317
(19 KB)
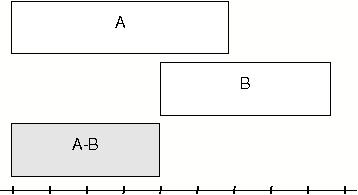
Figure 5.6(a): Illustration of set difference between two intervals - Upper bound of A overlaps B.
358 x 195
(12 KB)
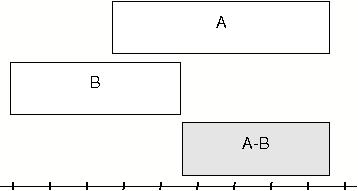
Figure 5.6(b): Illustration of set difference between two intervals - Lower bound of A overlaps B.
358 x 191
(12 KB)
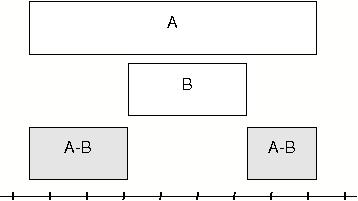
Figure 5.6(c): Illustration of set difference between two intervals - A overlaps B, but bounds do not overlap.
358 x 201
(12 KB)
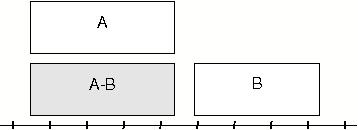
Figure 5.6(d): Illustration of set difference between two intervals - A does not overlap B.
358 x 130
(12 KB)
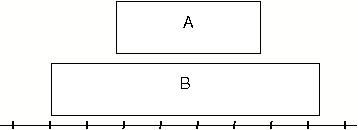
Figure 5.6(e): Illustration of set difference between two intervals - A completely subsumed by B.
358 x 130
(11 KB)
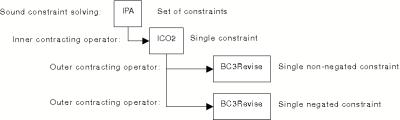
Figure 5.7: Illustration of the composition of a sound interval constraint solver by Benhamou et al. (2004).
826 x 248
(13 KB)
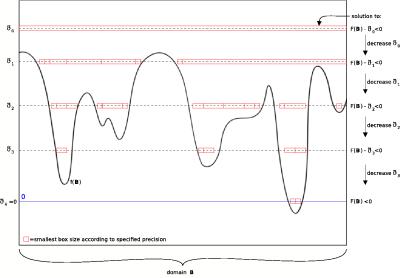
Figure 5.8: Illustration of interval optimization process.
1237 x 862
(2935 KB)
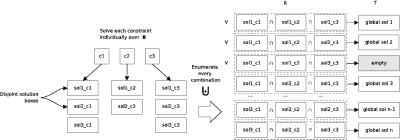
Figure 5.9: Illustration of the combination of solutions performed by the inner contracting operator (defined in Algorithm 5.1).
1385 x 486
(187 KB)
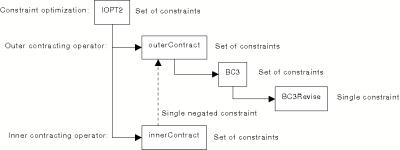
Figure 5.10: Illustration of the components of the interval optimization algorithm.
892 x 336
(14 KB)

Figure 5.11(a): Effect of threshold size on solving time - Standard benchmark (consistent): Satellite.
360 x 252
(45 KB)
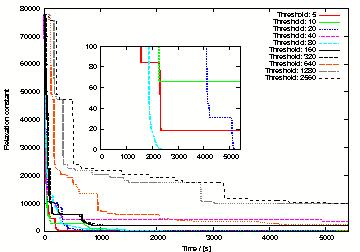
Figure 5.11(b): Effect of threshold size on solving time - Custom benchmark (consistent): Scene.
360 x 252
(59 KB)
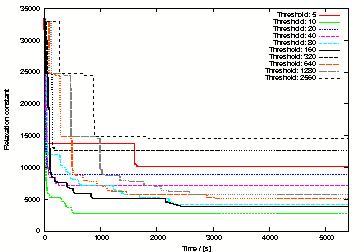
Figure 5.11(c): Effect of threshold size on solving time - Custom benchmark (inconsistent): Collision7.
360 x 252
(54 KB)